EFFECTIVE EARTHING - MEASURING TECHNIQUES
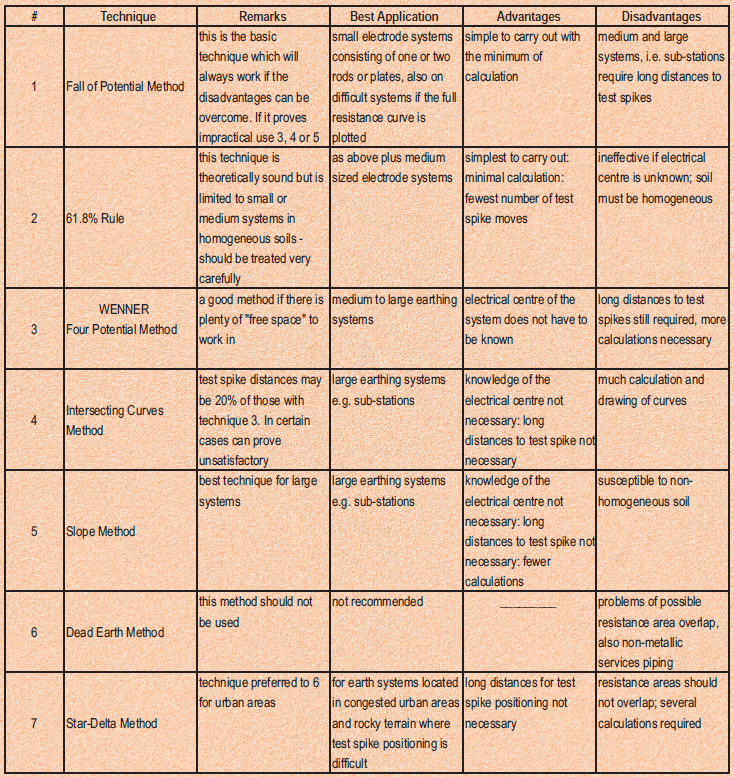
Seven basic earth resistance measuring techniques may be used and the suitability of each is summarised below.
Before embarking on an earth test:
1. Consider the accuracy of the result required.
2. Have a drawing of the earth electrode system to be tested.
REFERENCES
1. A simple guide to earth testing : Megger
SOIL RESISTIVITY SURVEYING
The greatest single factor determining the quality of an earth is the resistivity of the soil surrounding the electrode.
INTRODUCTION
Soil resistivity data is the key factor in designing an earthing system for a specific performance objective. All soil conducts electrical current, with some soils having good electrical conductivity while the majority has poor electrical conductivity.
The resistivity of soil varies widely throughout the world and changes dramatically within small areas. Soil resistivity is mainly influenced by the type of soil (clay, shale, etc.), moisture content, the amount of electrolytes (minerals and dissolved salts) and finally, temperature.
When designing an earthing system for a specific performance objective, it is necessary to accurately measure the soil resistivity of the site where the earth is to be installed. Earthing system design is an engineering process that removes the guesswork and “art” out of earthing. It allows earthing to be done “correctly, the first time”. The result is a cost saving. |
|
THEORY
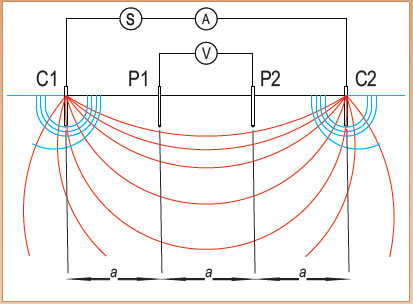
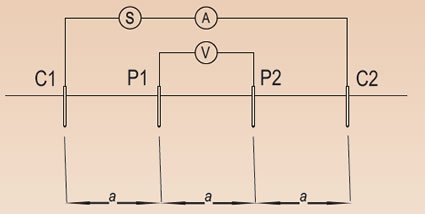
The best method for testing soil resistivity is the Wenner Four Point method. It uses a 4-pole digital ground resistance meter, probes, and conductors. It requires inserting four probes into the test area. The probes are installed in a straight line and equally spaced. The probes establish an electrical contact with the earth. The four pole test meter injects a constant current through the ground via the tester and the outer two probes. The current flowing through the earth (a resistive material) develops a voltage potential difference. This voltage drop resulting from the current flow is then measured between the two inner probes. The meter then knows the amount of current that is flowing through the earth and the voltage drop across the two center probes. With this information the meter uses Ohms law (R=V/I) to calculate and display the resistance in ohms This displayed resistance value is in ohms and must be converted to ohmsmeter, which are the units of measure for soil resistivity. Ohms-meter is the resistance of a volume of earth that is 1m x 1m x 1m.
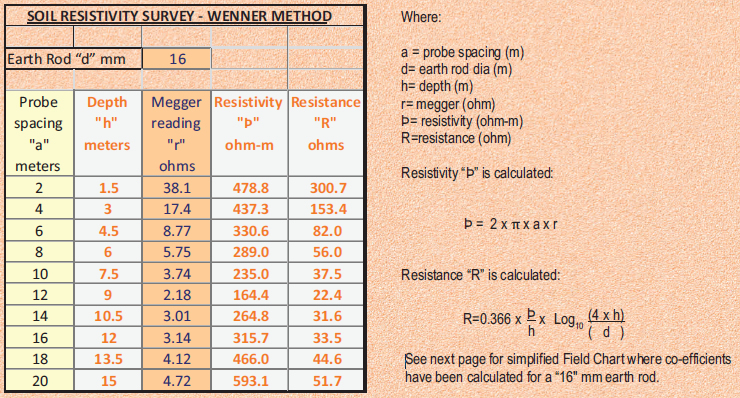
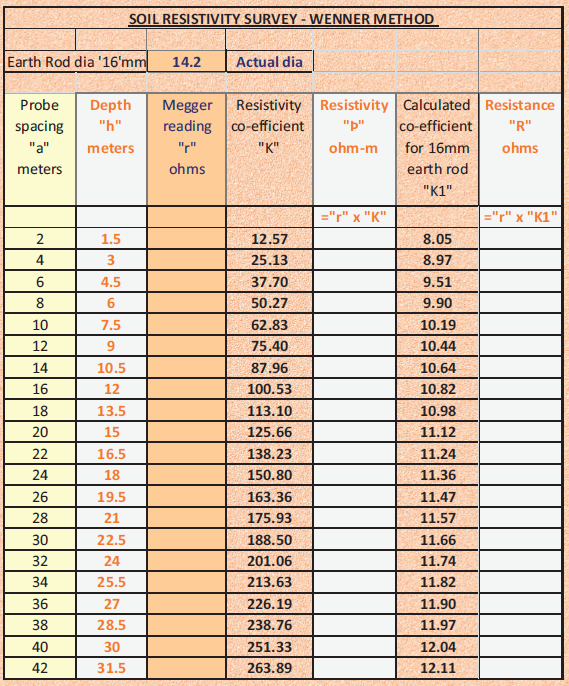
To establish the average resistivity of the soil in ohm/meters (Þ) between the surface and the depth (D), the megger reading must be
converted by employing the following formula:
Þ = 2πar where Þ = resistivity in ohm/meters a = the interval between probes r = the megger reading in ohms
Readings are usually taken at probe spacings of 2, 4, 6, 8, 10m,etc as shown in the following Field Sheet. The spacing of the probes; distance “a” MUST always be equal.
The calculated soil resistivity is the average of the soil resistivity from the surface to a depth equivalent (h) (0.75xa) of the probe spacing. A probe spacing of 4m (a) between each probe will provide the average soil resistivity between the surface and a depth of 3m(h).
Several readings at the different probe spacings and at different areas of the site are required. The more data available the more accurately will be the design of the grounding system.
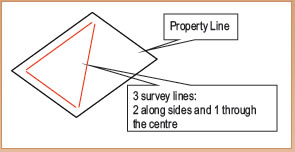
Readings should be taken along at least two sides of the site and diagonally from one corner to another. A pipe or some underground
structure could influence the readings. The more data available and used in the design provides more confidence in the outcome.
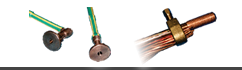
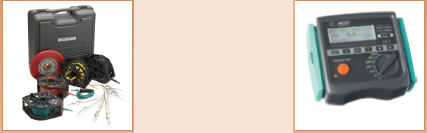
Equipment Required
• A 4-Pole Digital - Earth Resistance Tester
• Four insulated wire conductors
• Hammer (to drive probes)
• At least four probes
• Measuring tape
• User’s Manual for Meter
PROCEDURE
The following procedure is generic and will work with all meters. The meter’s manual should be consulted for operational details.
Step 1. Verify that the metal strip between the meter’s C1 and P1 terminals is disconnected (used for 3-Point testing).
Step 2. Install the 4 test probes in the ground equally spaced in a straight line. Generally the shorter spacing is done first.

Step 3. Using the conductors, connect the C1, P1, P2 and C2 terminals to the electrodes. The electrodes must be connected in order from the end, to the C1, P1, P2 and C2 terminals. The test results will be invalid if the electrodes are not connected properly.
Step 4. Press the test button and read the digital display. Record the reading on the Field Sheet at the appropriate location. If the reading is not stable or displays an error indication, double check the connections. For some meters, the RANGE and TEST CURRENT settings may be changed until a combination that provides a stable reading without error indications is reached.
Also, an effective way of decreasing the electrode resistance to ground is by pouring water around it. The addition of moisture is insignificant for the reading; it will only achieve a better electrical connection and will not influence the overall results. Also a longer probe or multiple probes (within a short distance) may help.
Step 5. Place the probes at each of the spacings indicated below and record the readings on the Field Sheet. Probes MUST be at EQUAL spacings (distance “a”). (See below).
Steps 1-5 of this procedure must be repeated at multiple locations on the site to obtain a reliable soil profile.
Stray currents, buried water pipes, cable sheaths and other factors may interfere and distort the readings. Measurements should be taken along 3 directions at each site as a minimum. Sometimes this may not be feasible, but the more data that can be obtained, the more accurate the generated soil model will be.
SURVEY LAYOUT
Building A Soil Resistivity Profile
A minimum of 3 “Lines” of testing should be performed.
FIELD SHEET: Record “r” in column: Megger reading. |
|
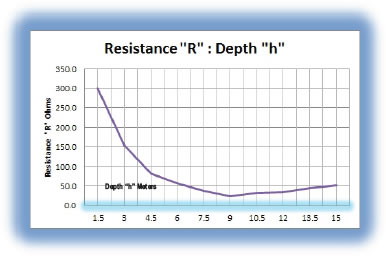
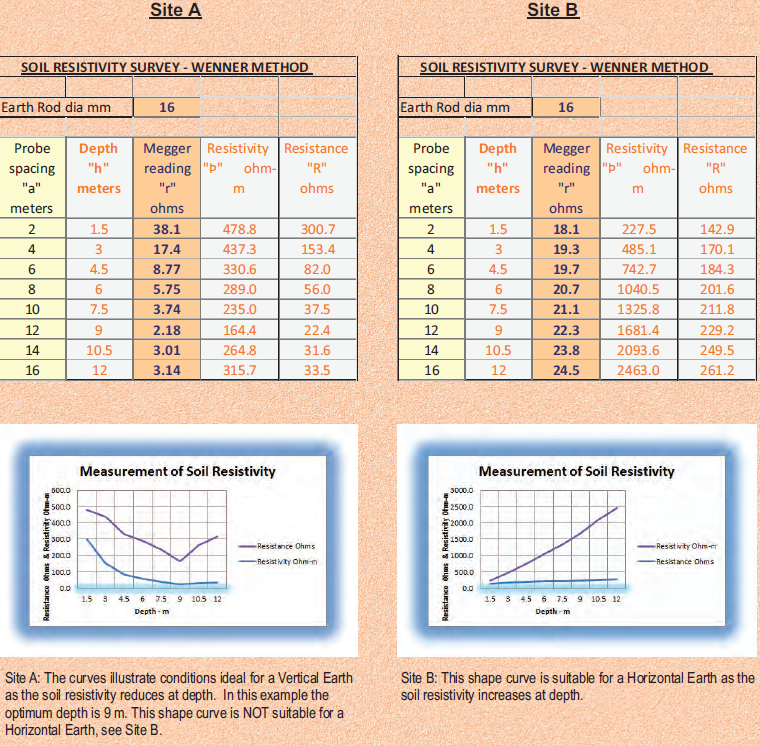
It can be seen from the graph that the optimum depth for earth rods is 9m. Any deeper, the graph starts to slope upwards thus there is no gain going deeper.
Use the following Soil Survey Sheet for site survey. Fill in the megger reading against each probe spacing.
Calculate the results for “Þ” and “R”.
Interpret results. See following page
SURVEY RESULTS INTERPRETATION
After completing the field/site survey the data is calculated with the resulting graphs showing the Resistivity and Electrode Resistance.
Examples below illustrate where:
Site A : a “ Vertical Earth” or “deep driven earth electrode system”
AND
Site B : a “Horizontal Earth” or “horizontal earth electrode system”
should be used.
PRACTICAL HINTS ON SOIL RESISTIVITY SURVEYING
- - If your meter reads zero:
- check all terminals and probes are correctly installed and connected
- if it continues to read zero it is likely that water has been reached
- - Ensure that the survey is not running parallel:
- to an existing earth trench
- to a water pipe
- to an armoured underground electrical cable
- - Terrain:
- always best to survey over virgin ground without underground facilities
- if there is no alternative try to cross at right-angles
- similarity if there is a fence conduct survey at right-angles
- - Operation of Meter:
- do NOT operate meter whilst any personnel are handling the probes
- - Damp conditions:
- will not adversely affect the survey, providing there is no surface water short circuiting the probes.
|
|